
The history of rankings, mechanisms of their appearing and reasons of their popularity are little scrutinized yet although they are widely spread in the modern information flow, they are widely used during the evaluation for organizations of the Ministry of Education and Science of Russia and the Russian Academy of Science as key indices.
The main objective of rankings is to obtain quickly, visually and simply explicitly interpreted experts’ opinion. One of the reasons of rankings’ popularity may possibly be a human brain addiction to unite data arrays into larger groups. This psychological pattern “seven plus-minus two” was formulated for the first time by the American psychologist George Miller [1]. His research shows that a common person can remember 7 + 2 elements at a time. If there are more elements, the brain divides information into subgroups so as their number could not exceed from five to nine elements.
First rankings appeared as credit rankings of risk evaluation for the American bonds in 1909. During more than four hundred years’ history of modern European markets of capitals the majority of securities were issued by the countries and governments able and eager to fulfil their liabilities to which investors trusted anyway. The situation with the USA was different. By the time John Moody began rating securities, the market for corporate bonds of the USA had been several times larger than in any other country. Since 1970-s rating agencies have become on the top of financial globalization and widened their activities. The period from 1970-s until nowadays was characterized by the steady growth of rating business. While in the beginning of 1980-s there were not more than 30 agencies in the world, in the end of 1980-s the world rating market included both global and regional and national agencies. The number of rating agencies increased as well as the number of analysts in the leading rating agencies and the number of yearly rankings and rated emitters [2].
Besides, the change of the way of funding of their operations by rating agencies became an important incentive for the increasing interest for ratings. Originally, agencies’ incomes came from their selling the reports to subscribers. Since 1970-s they have charged the securities emitters, who were ranked. In such a way, the information about ratings became widely available.
The history of rankings, having started as the history of bonds’ credit ratings, nowadays covers practically all spheres with high competition and nontrivial quality. Service sphere, which includes banking, finance, insurance, major part of economic activity and the last but not least – education – has got this quality. After a long period of discussions education was defined as a public good according to the current legislation (“Education is an integral purposeful process of teaching and upbringing which is considered an important public good and is realized on behalf of a man, family, society and state, as well as a totality of acquired knowledge and skills, axiological aims, activity experience and competence of a certain volume and complexity with a view to develop a man intellectually, morally, spiritually, creatively, physically and/or professionally; to meet his/her educational needs and interests” [3]), but at the same time it is possible to speak about services in the sphere of education or educational services.
Russian history of ranking in the sphere of education began in 2001. By 2014 eight attempts for creation of rankings have become the most known. Every ranking was created by various participants of the system of education: by the state, employers, student community as the customers of education services and Information Agency “Novosti” (the News) and the National Research University “The Higher School of Economics” according to the order of the Public Chamber of Russia.
1. Federal Education Agency made the ranking according to the forms, which are filled in by the university authorities. In fact, here we see the representation of fulfillment and overfulfillment for the accreditation indices.
2. Publishing House “Kommersant” (“Businessman”) questioned the largest Russian enterprises collecting information about the young specialists – graduates from the universities, who were taken on during the previous year.
3. A special agency was established in 2005 by the Charity Foundation of Oleg Deripaska “Liberal Business” for the independent university evaluation and ranking creation. In particular, during this time there were prepared rankings on research achievements of the Russian universities, on education of the representatives of scientific, educational and state elite, on the prices for education in Moscow universities and many others. The top activity for the agency we may assume the first Russian Global University Rating which was represented in 2009 [4].
4. The attempt to evaluate universities according to the employment of the university graduates was undertaken once by the HR portal “superjob.ru”. Criteria chosen were the ability to be employed, the level of the salary expected, etc. This ranking divided universities into groups or leagues.
5. Students’ ranking of Russian universities is interesting because this is the only case in Russia when the students’ opinions are taken into account. Foreign systems of evaluation use this kind of feedback while the Russian ones have not resolved to do this yet. Criterial indices are quite dynamic and this fact shows that the project develops.
6. Rankings of The Higher School of Economics and Information Agency “Novosti” by the order of the Public Chamber of Russia in the frame of the project on the control for entering the universities considered which universities with which organization forms and what specialities school-leavers choose.
7. Ranking of the branch structure for the Russian news agency “Interfaks” – JSC “Inform-Invest” – is an attempt to rank the Russian universities as social institutions. Educational activities have a specific weight of 20 while the scientific research work has 20 as well. The rest is the university brand, social opinion, international affairs.
8. LLC “Delovaya Rossiya” (Business Russia) created a ranking, rating universities with regard to the regional specificity as graduates’ supplier according to the university-employer relationship and the salary level of graduates.
We can put the diagram of spheres of interest for all rankings except the third one in the following way:
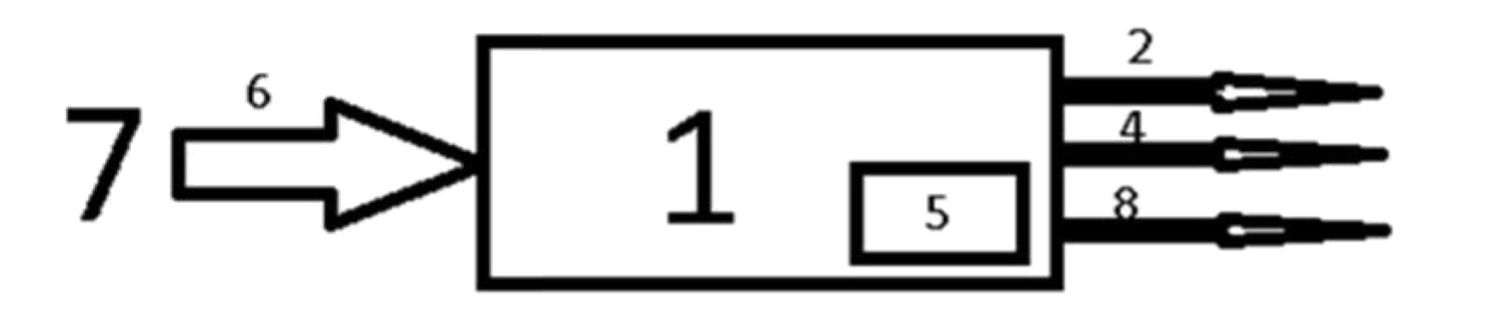
Fig. 1. Spheres of interest for rankings 1-2, 4-8.
The first ranking describes the university state, i.e. its readiness for teaching.
The second, the fourth and the eighth one are for the successfulness of graduates on the labour market.
The fifth ranking assesses the learning process from the point of students’ view.
The sixth is arranged according to the applicants’ choice.
The seventh assesses the function of socialization, but not the education quality.
There are many rankings in the sphere of education, the most well-known among them being the following three [5, 6]:
1. QS World University Rankings is the rating for the best world universities. It is provided by Quacquarelli Symonds and has been published yearly since 2004. 712 universities were assessed in 2011: Cambridge University of Great Britain, Harvard University and Massachusetts Technological Institute were on the top of the rankings. We should not confuse QS rating with the world university ranking THE. From 2004 until 2009 QS rankings were being published in collaboration with THE and were known as Times Higher Education-QS World University Rankings. In 2010 QS published the only ranking created with the help of the old methods, when THE parted from QS for the creation of the new methods for ranking building in collaboration with Thomson Reuters. QS Ranking was published in U.S. News & World Report under the name of “The best universities in the world”.
2. The Academic Ranking of World Universities (ARWU) was created by Shanghai University Jiao Tong and it is published every year since 2003. This ranking is considered to be one of the oldest university rankings in the world. Today this ranking is maintained by the specialized company Shanghai Ranking Consultancy. It is financed by the Chinese government; its original goal was to assess differences between the Chinese universities and the world-class universities. ARWU is published in the British journal “The Economist”. Indices are rated according to qualitative and quantitative data about publications and characterize the quality of the teaching staff and scientific research efficiency of the university.
3. The world university ranking Times Higher Education (THE). In 2004 – 2009 the British publishing house Times Higher Education (THE) published the yearly ranking Times Higher Education-QS World University Rankings in collaboration with Quacquarelli Symonds (QS). THE published the ranking of 200 best universities and QS ranked online approximately 500 universities published the outcomes with the help of media partners. On October 30, 2009, THE ceased working with QS and joined Thomson Reuters to create the new world university ranking under the name of Times Higher Education World University Rankings. THE declared the academic opinion to become a part of its new ranking. On June 3, 2010, THE showed the method which was suggested to use for the creation of the new world university ranking. The new method included 13 separate criteria for efficiency instead of 6 used between 2004 and 2009. After additional consultations criteria were classified according to five general key indicators to finally rank the universities. On September 16, 2010, one month earlier than in previous years, THE published the first ranking using the new method.
Let’s tabulate criterial indices of the world leading ratings and their weight.
Table 1. Criterial indices of the world leading universities ratings.
| ARWU | THE | QS | |
| Publications | 40 | 32,5 | 20 |
| Number of papers published in Nature or Science | 20 | ||
| Number of frequently cited publication (quotation indicator SCIE - Science Citation Index-Expanded and SSCI - Social Science Citation Index) | 20 | ||
| Citation index of scientific papers of the faculty relative to the number of teaching staff (database Scopus) | 20 | ||
| Citation number from papers published in Web of Science | 32,5 | ||
| Teaching staff quality | 40 | 40,75 | 45 |
| Number of teachers having Nobel prizes or Fields medals | 20 | ||
| The number of staff publications frequently cited in scholarly journals | 20 | ||
| The ratio of the number of foreign teachers to the local teachers | 3 | 5 | |
| Academic reputation: a survey of experts | 19,5 | 40 | |
| The ratio of income from innovative engineering, to the number of teachers | 2,5 | ||
| The ratio of income from research activities to the number of scientific researchers | 5,25 | ||
| The ratio of the number of scientific publications to the number of university staff | 4,5 | ||
| The ratio of the number of post-doctoral students to the number of teachers | 6 | ||
| The quality of education | 10 | 26 | 25 |
| The number of graduates having Nobel prize of Fields medal | 10 | ||
| Academic reputation – a survey of 13000 respondents | 15 | ||
| The ratio of the university income to the number of teaching staff | 2,25 | ||
| The ratio of the teaching staff to the number of students | 20 | ||
| The ratio of the number of the first-year students to the number of teachers | 4,5 | ||
| The ratio of the number of post-doctoral students to the number of bachelors | 2,25 | ||
| The ratio of the number of foreign students to the local citizens-students | 2 | 5 | |
| Academic efficiency | 10 | 0,75 | |
| The ratio of the five previous indices to the number of the university teaching staff | 10 | ||
| The ratio of the income from the research activity to the total university income | 0,75 | ||
| Other | 10 | ||
| Academic reputation: a survey of employers | 10 |
Let us consider the Shanghai ranking indices in detail.
The quality of education is assessed exceptionally by the number of graduates-laureates of Nobel Prize and Fields Medal.
Before we judge their relevance, let’s have a look at these prizes.
Fields medal. It is awarded every four years in mathematics; it was not presented in 1936 and 1950. From 1936 till 2014 it was presented 18 times. 58 people became the laureates of this prize [7].
Nobel Prize. These are the most prestigious international prizes, presented every year for the outstanding scientific research, inventions or the great contribution to the culture or society development [8].
The first-hand determining of laureates is granted to the Swedish Royal Academy of Sciences (prizes in physics and chemistry), Caroline Institute (prizes in physiology or medicine), Norway Parliament (peace prize) and Swedish Academy (prize in literature). Prize in economics was established much later and it is the first and the only supplement to the Nobel’s list. It was established by the Swedish State Bank in 1968, in the year of its 300-year anniversary. Since that time every bank has transferred to the Nobel fund the sum equivalent to one Nobel Prize. All together in 1901-2008 809 laureates were awarded the Nobel Prize (both 789 people and 20 organizations).
Correctness of increasing university status raises doubts because the laureate of a certain prize graduated this university 40 years ago on average, and the majority of winners get the prize in a quite advanced age. Figure 2 shows a graph about the distribution of laureates according to their age from the official web-site of Nobel Prize.
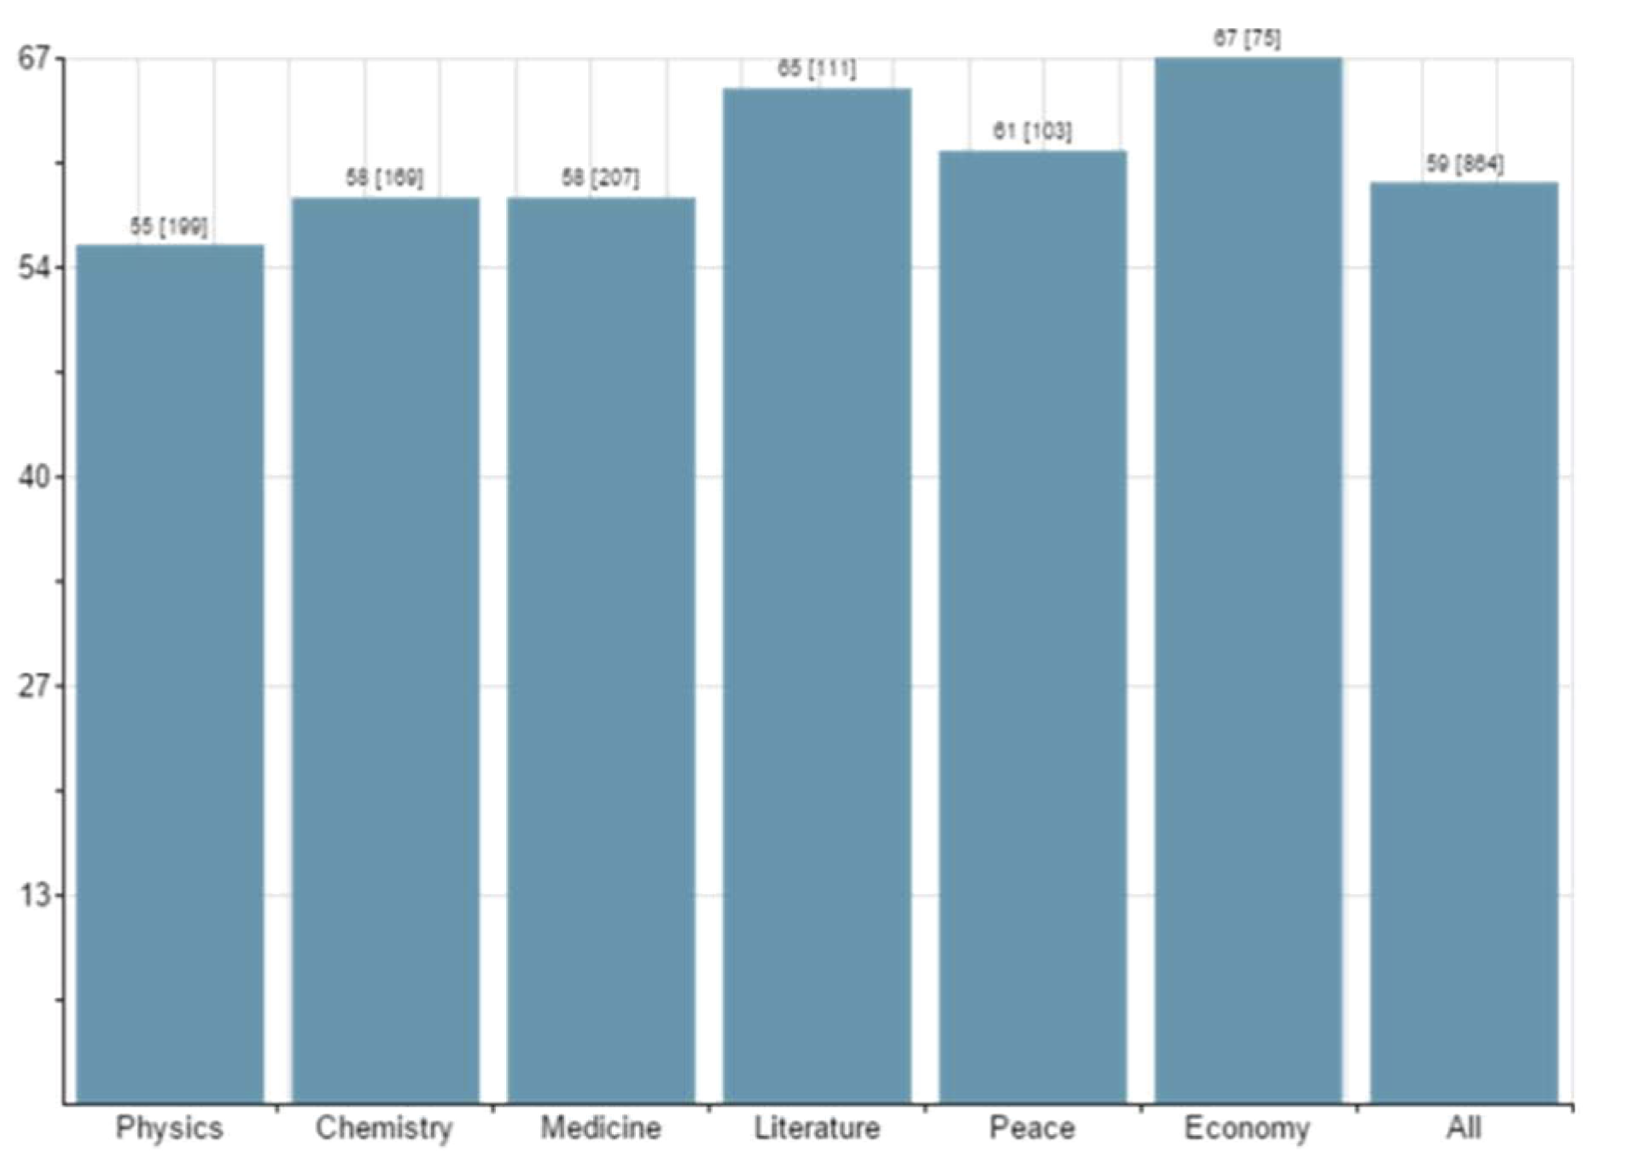
Fig. 2. The average age of Nobel Prize winners
Looking at statistics of the Nobel Prize laureates let’s separate the number of laureates form the English- speaking countries.
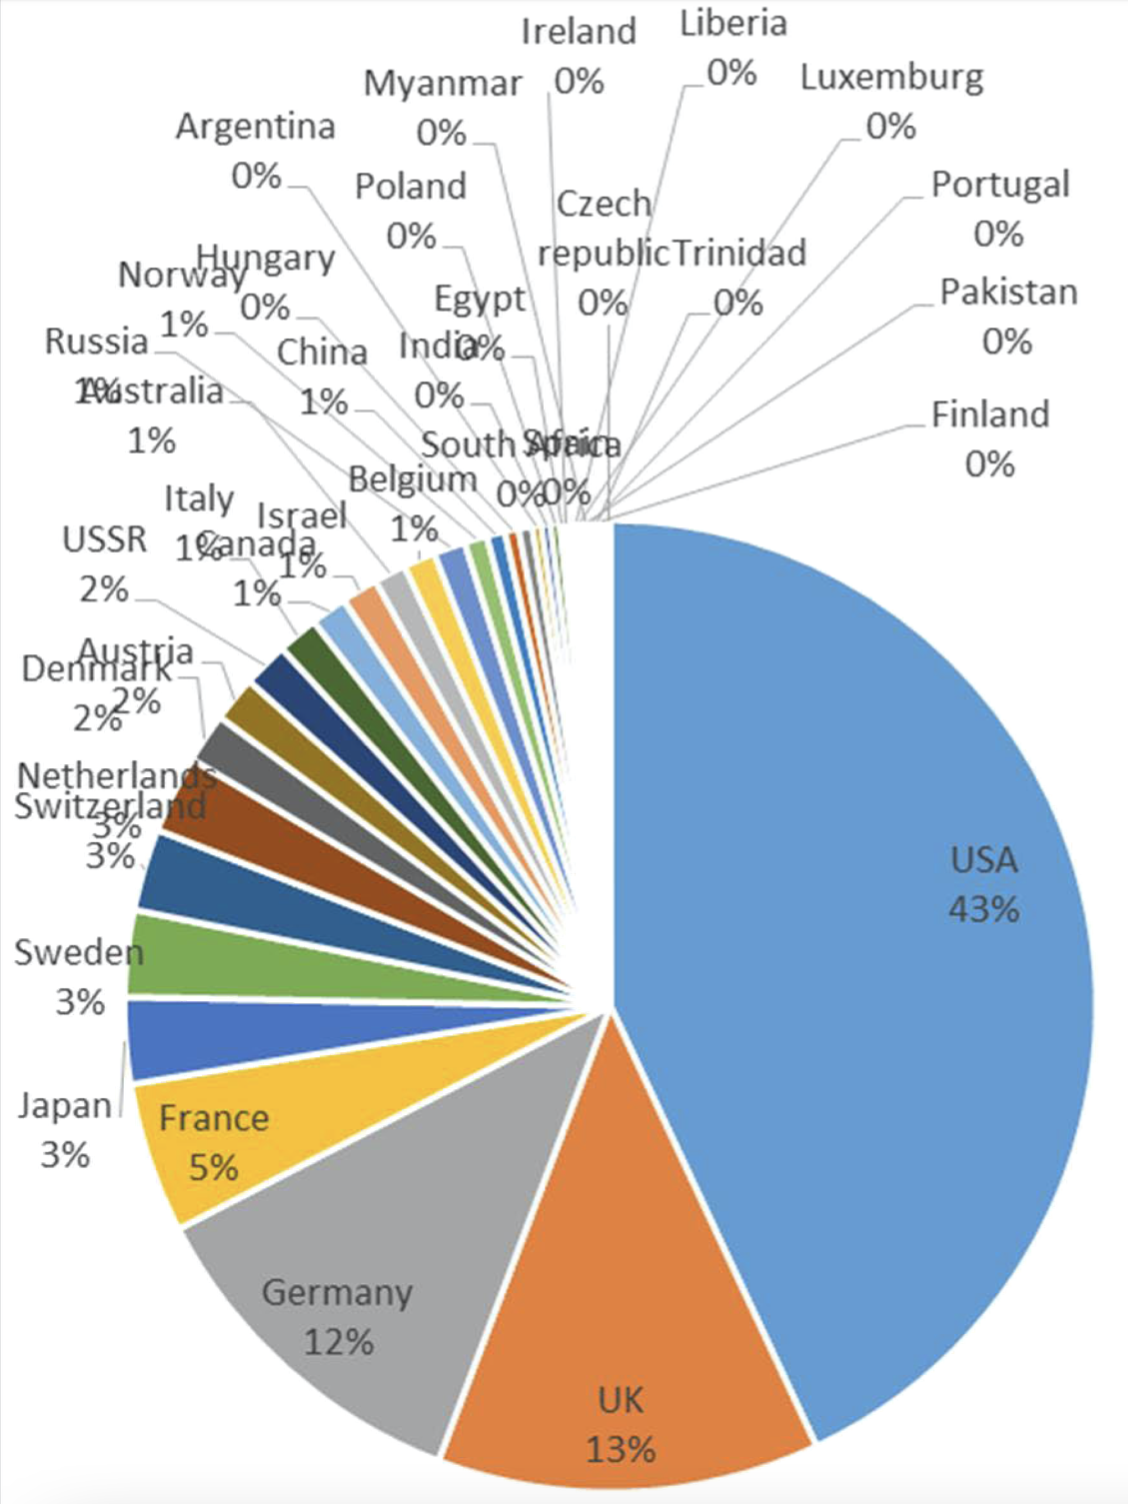
Fig. 3. The Nobel Prize laureates’ distribution by their residence
Here we can see that the largest sector, i.e. 36% (314 from 863 prizes presented before 2015 with the exception for 23 prizes for organizations) belong to the citizens of the USA.
14% is for the citizens of the other English-speaking countries: 106 (12%) for the UK, 8 (approx. 1%) for Australia and 10 (approx. 1%) for Canada.
The number of Nobel Prize winners among graduates index is partially one of the reasons for the fact that there are so many universities from English-speaking countries in university rankings: 68 in TOP 100 ARWU, among them there being 52 universities from the USA, 8 from the UK, 4 from Australia and 4 from Canada.
We also cannot help mentioning that ranking creators took into account the rate of time limitation for the assessment of the contribution of Nobel and Fields prizes winners for the quality of education.
The number of graduates-winners of the Nobel or Fields prizes. In ARWU ranking [9] graduates are those who earned any degree at the university: both bachelors, masters and doctors. To reflect objectively academic progress of the university the university graduates get different weight factors. Every 10 years reduce the rate for 10%. For instance, while graduates of 2001-2010 get the weight factor of 100%, graduates of 1991-2000 have the weight of 90%, of 1911-1920 – 10%. If the graduate earned two or more degrees at this university, the ranking takes into account only the last one. If the laureate graduated from two universities, each of them will get 50%. If several laureates share one Nobel Prize, their proportional part is taken into account in the ranking.
A similar methodology is used for the university staff-winners of Nobel Scientific Prize (we consider only those who won the Prize in physics, chemistry, physiology or medicine and economics). To reflect objectively university academic progress ranking methodology provides for different weight factors. Every 10 years reduce the rate for 10%. Different weights are set according to the periods of winning the prizes. The weight is 100% for winners after 2011, 90% for winners in 2001-2010, 80% for winners in 1991-2000, 70% for winners in 1981-1990, and so on, and finally 10% for winners in 1921-1930. Staff is defined as those who work at an institution at the time of winning the prize. If the laureate is affiliated with two or more universities each university will get 50%. If several laureates win one Nobel Prize their proportional rate is taken into account.
Let’s have a look at the changes in the top 100 of the universities if s rate is excluded:
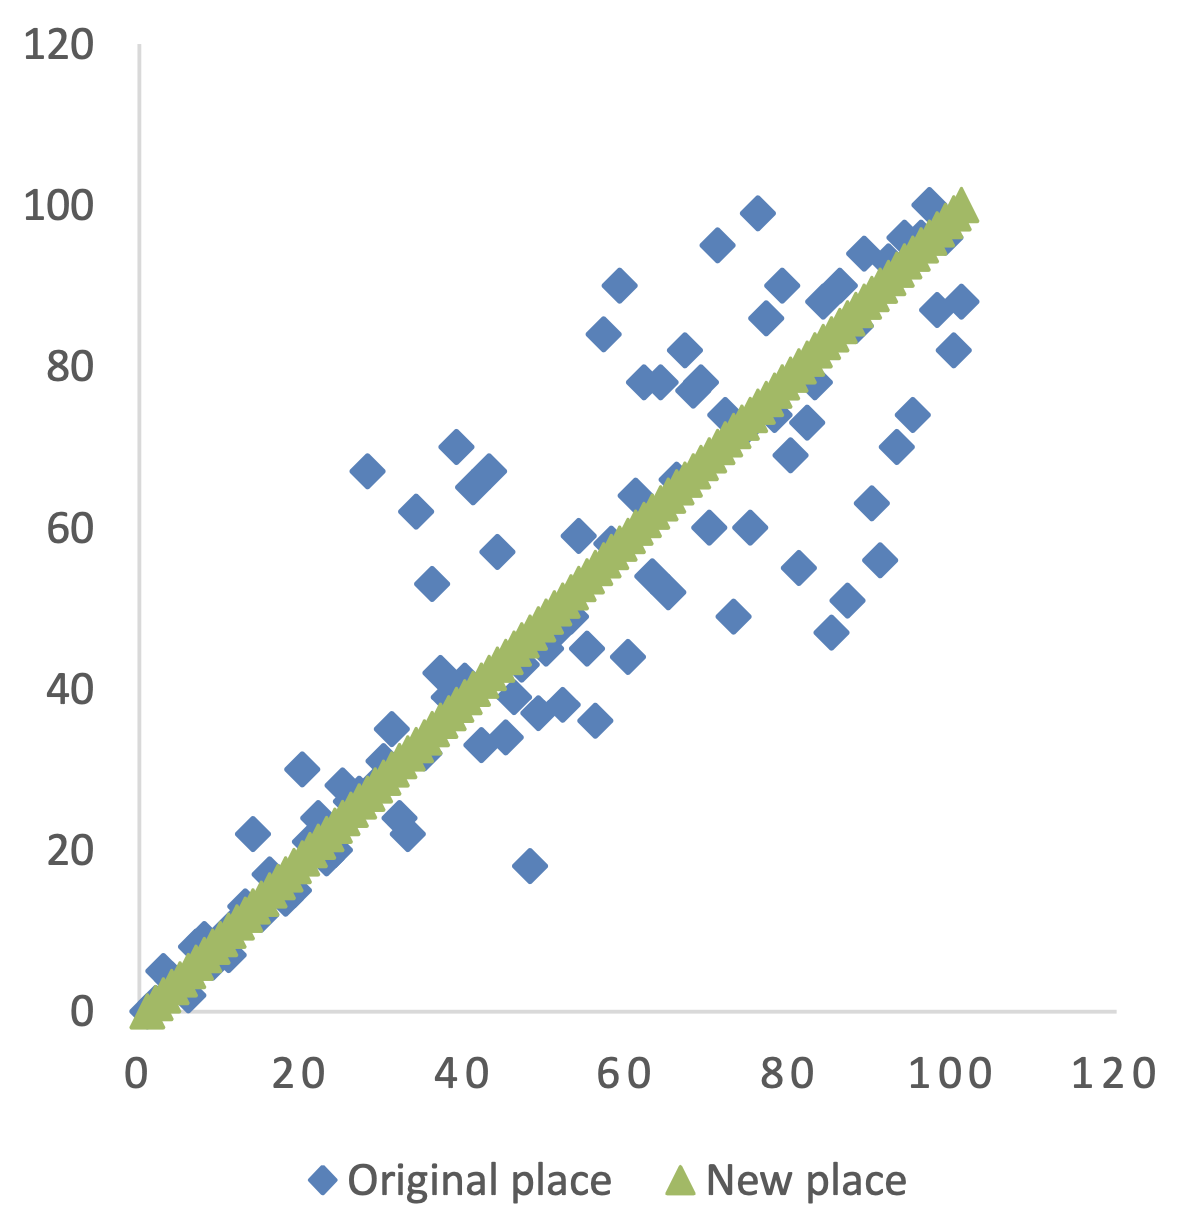
Fig. 4. The original and new places for the top 100 universities with Nobel Prize index excluded
Universities, which lost their positions:
Table 2. Original and new positions of the top 100 universities
| University | Original place | Difference | New place |
| University of California, Irvine | 47 | -37 | 84 |
| University Of Southern California | 51 | -35 | 86 |
| University of Zurich | 56 | -34 | 90 |
| University of California-San Francisco | 18 | -29 | 47 |
| University of Bristol | 63 | -26 | 89 |
| University of California, Davis | 55 | -25 | 80 |
| Heidelberg University | 49 | -23 | 72 |
| Ghent University | 70 | -22 | 92 |
| Aarhus university | 74 | -20 | 94 |
| The University of North Carolina, Chapel-Hill | 36 | -19 | 55 |
| The University Of Groningen | 82 | -17 | 99 |
| Melbourne University | 44 | -15 | 59 |
| Uppsala University | 60 | -14 | 74 |
| Manchester University | 38 | -13 | 51 |
| State University of New Jersey. Rutgers New Brunswick | 52 | -12 | 64 |
| The University of Arizona | 88 | -12 | 100 |
| The University Of British Columbia | 37 | -11 | 48 |
Table 3. Original and new positions of the universities, which improved their places
| University | Original place | Difference | New place |
| Minnesota University | 30 | 11 | 19 |
| The University of Basel | 90 | 12 | 78 |
| University of Utrecht | 57 | 14 | 43 |
| Stockholm University | 78 | 15 | 63 |
| University William Marsh Rice | 82 | 16 | 66 |
| The University of Florida | 78 | 17 | 61 |
| Technical University of Munich | 53 | 18 | 35 |
| Georgia Institute of Technology | 99 | 24 | 75 |
| Pittsburg University | 65 | 25 | 40 |
| McGill University | 67 | 25 | 42 |
| University Strasbourg | 95 | 25 | 70 |
| Lomonosov Moscow State University | 84 | 28 | 56 |
| Carnegie — Mellon University | 62 | 29 | 33 |
| Hebrew University of Jerusalem | 70 | 32 | 38 |
| Rochester University | 90 | 32 | 58 |
| École Normale supérieure, Paris | 67 | 40 | 27 |
The two thirds of universities (67%) changed their places for less than 10% in one way or another.
Both QS World University Rankings and Times Higher Education Rankings are created by the organizations – the owners of the largest rankings and science literature agencies. Naturally the rate of indices connected with publishing is rather high. Here we see the specificity and main vulnerability of objectiveness for these rankings.
Is it possible to create a more accurate world ranking which could allow obtaining reliable, supported by expert ranking information from several dozen world universities? We think it to be unlikely. That is why it is no good considering only one aspect of these rankings in positive or negative way. We’d better understand it in the following way: these rankings show only certain aspects but they declare wider things.
What to do in the situation when rankings are necessary but the methodology of none of them meets the requirements? With the exception of two extreme variants: rejection of ranking or accepting of the existing ones as not having alternatives, there are two compromise variants.
The first one is the possibility of the creation of our own rankings on the basis of existing rankings. Creation of the ranking “on the basis” is possible only with the existing data collected by the specialists of the rating agency. The degree of confidence in them is not discussed, it is considered to be high. Then what can be changed? The weight of these criteria as it as shown above, with the exclusion of certain data. It is possible to give a zero value and others basing on the goals and objectives of the analysis.
The second variant which looks much more difficult in its realization and less obvious is including social space criteria. The model of a similar ranking can be realized with the help of widely available data of the world rankings but its consideration is beyond the scope of this article.
Conclusions
Ranking is oriented on the external quality indices and can be realized by even non-experts in the sphere of education. Ranking assesses the university popularity rather than the quality of its education. It is published in mass media and causes public response. Among the indices of the three most popular ranking systems there is no index showing the quality of educational process organization, technical and material equipment and the professional level of the faculty.
At the same time we cannot reject the fact that these indices characterize certain aspects of the university activity. In fact, what it involves is the attempt to assess the universities’ brands. Branding is one of the marketing directions, and like the brand value may exceed the value of all tangible assets of the company for the large commercial companies, it is natural that the index of the university popularity plays an important role for the system of education.
References
1. G.A. Miller, The Psychological Review, 63, 81—97 (1956)
2. Materials of rating agency “Expert RA”. Available online: URL http://raexpert.ru/ratings/history (accessed on May 16, 2015)
3. Materials of the portal GARANT. Available online: URL http://base.garant.ru/70291362/1/#block_1000#ixzz3fdXTQWte (accessed on April 5, 2015)
4. Materials of the portal STRF. Available online: URL http://www.strf.ru/material.aspx?CatalogId=221&d_ no=38618#.U28aTvl_tFs (Accessed on May 11, 2014)
5. A.Zirulnick, The Christian Science Monitor. Available online: URL http://www.csmonitor.com/World/2010/0916/New- world-university-ranking-puts-Harvard-back-on-top (accessed on October 14, 2011)
6. I. Samarasekera and C. Amrhein, The Edmonton Journal. Available online: URL http://www.pressreader.com/canada/edmonton- journal/20100922/282870842154432 (accessed on October 14, 2011)
7. Materials upon Fields Medal. Available at URL: http://www.mathunion.org/index.php?id=prizewinner s (accessed on March 22, 2015)
8. News agency “Novosti” portal. Available at URL: http://ria.ru/society/20081210/156901078.html#ixzz3 eX5O0Bo6 (accessed on March 22, 2015)
9. Materials of the web-site Shanghairanking. Available at URL: http://www.shanghairanking.com/ARWU- Methodology-2015.html (accessed on March 22, 2015) DOI: 10.1051/shsconf/20162901006
Published in: Bebenina,V. Rankings in education: history and critical analysis of rates// SHS Web of Conferences. 2016. Vol. 29. P. 01006.